Your team is sure the new version is better. Sometimes the numbers need a few weeks to agree.
Last week’s post, Pretty Sure, was about the gap between feeling sure and being right, in your customers and in your team. It was better received than most posts here, so thank you for reading it and passing it on.
This one is about the people on the other side of the product: the team that builds it, and the people who sign off on its launch. They are all pretty convinced that the new version is better, and that the numbers will show it from day one. They usually know where the product will end up. They often misjudge the way to get there.
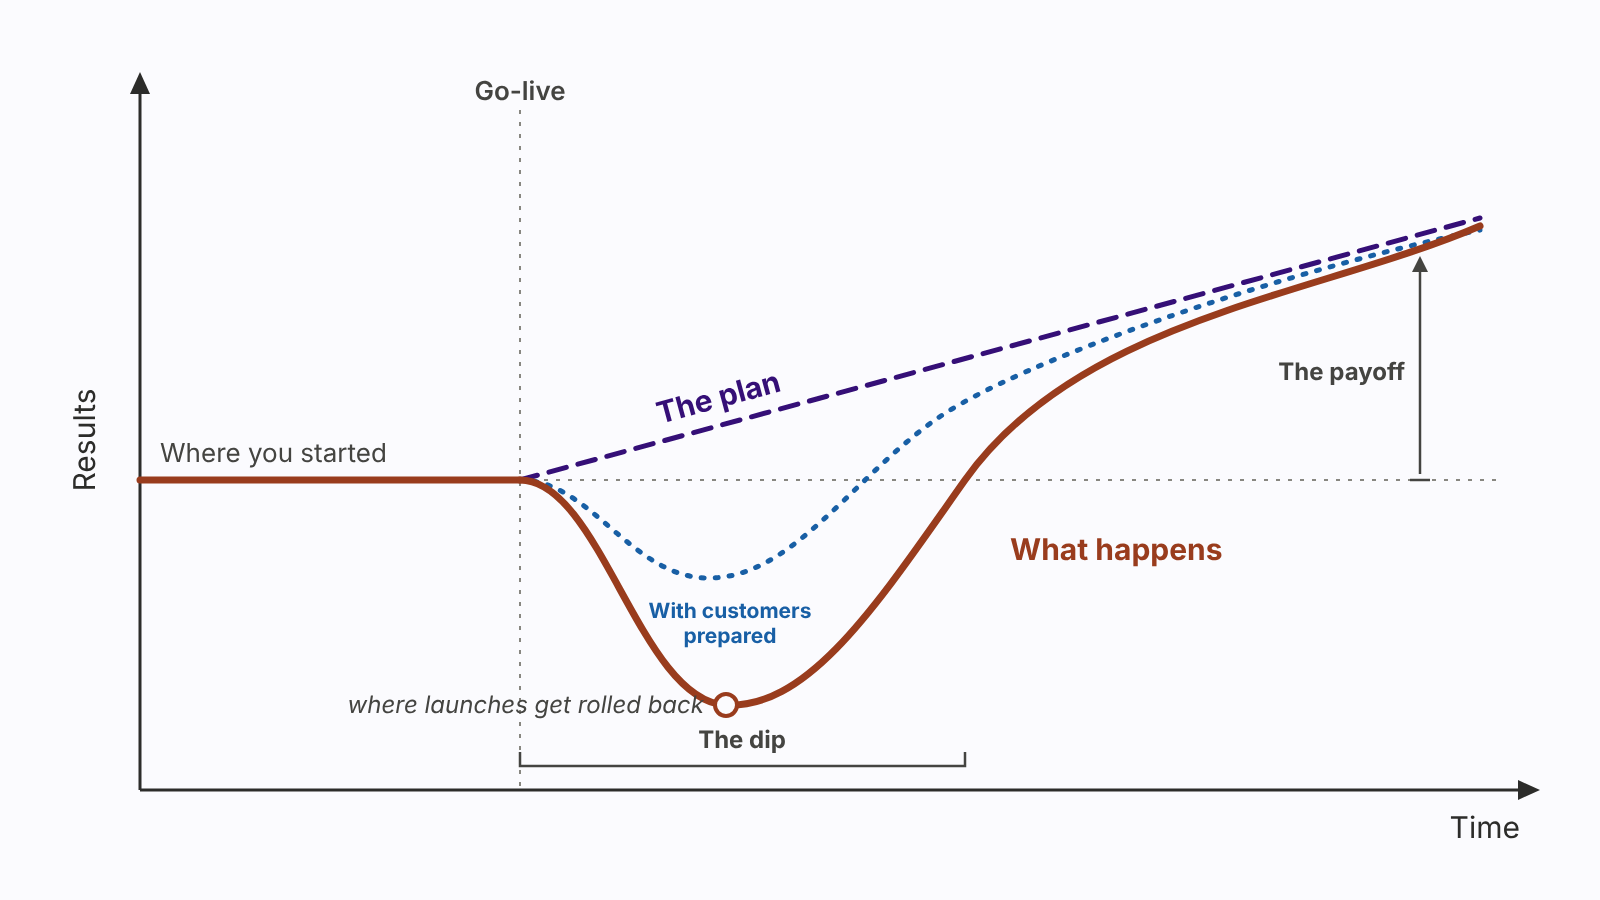
What they miss has a name, the J-curve, and it shows up a few days after almost every launch.
You ship a redesign, a new checkout, a new onboarding, a new pricing page. Within days the numbers move the wrong way. Tasks take longer. Support tickets go up. Satisfaction scores dip, and a few customers write to you in capital letters. If the change was a good one, the numbers recover over the following weeks and end up higher than they were before the launch. Plot it and you get a J: a short dip, then a long rise.
The shape is well documented. Economists Erik Brynjolfsson, Daniel Rock and Chad Syverson found it across the whole US economy(1). When companies adopt a technology that changes how most of their work gets done, such as computers or AI, they spend the early years building things the official statistics barely count: new processes, new products, new skills, new ways of doing business. So productivity looks weaker than it is at first, and stronger later, once those investments pay off.
User researchers at Google see the same pattern in single products and call it change aversion(2). Satisfaction drops after a noticeable launch and recovers as people get used to the new normal, back to where it was or higher, provided the change really was an improvement. If it made the product worse, satisfaction settles lower and stays there. As they put it, “change aversion isn’t an excuse for worsening user experience.”
So far, so reasonable. The trouble is that almost every launch plan draws a different line. It may be straight, it may curve upwards like a hockey stick, it may follow whatever shape the forecast model prefers. What it almost never has is a dip after launch.
John Gourville at Harvard Business School described the mechanism in 2006(3). People who build a new product tend to overvalue it by a factor of about three, because they have lived with it for months and know exactly what it improves. Customers tend to overvalue what they already use by about the same factor, because giving up something familiar feels like a loss. Put the two together and you get what he called a nine-to-one mismatch. On launch day the team is convinced the new version is better, and the customers are convinced the old one was. Each side is reasoning from its own experience, and each is off by a similar margin.
Then there is the calendar. Roger Buehler, Dale Griffin and Michael Ross asked students to predict when they would finish their thesis(4). The average prediction was 34 days. The average student took 56. Fewer than a third finished by their own estimate, and fewer than half finished by the date they gave for the case where everything went as badly as it possibly could. Launch plans are written by the same kind of people, a few years older. I once argued, in Fool Yourself with Style, that this optimism is useful: it is what gets a project on the calendar in the first place. I still think so. Once the project needs a budget, though, it also needs a realistic picture of what happens after launch.
Put a nine-to-one mismatch and an optimistic calendar together and you reach the most dangerous point in a product’s life: the bottom of the J. The metrics are at their lowest. The team is in its own valley of despair, reading every angry ticket. And the people who signed off on the straight line are looking at a dashboard that points down. This is where the old version comes back “temporarily”, the roadmap gets rewritten, and someone schedules a post-mortem for a product that was three weeks from recovering. Sometimes the rollback is the right call, because the change really was worse. Without an expected dip written down in advance, nobody can tell which case they are in.
The fix is cheap, and it comes from that same post: picture the result you want, then the obstacles on the way to it. Draw the J before you launch. One page: which numbers will dip, by roughly how much, for how long, and the point at which a dip becomes a failure. Show it to whoever holds the budget and get their agreement before go-live, while everyone is still pretty convinced. When the dip comes, it arrives as planned.
Then make the dip shallower. Then make the dip shallower. The same Google research suggests a few simple steps(2). Tell customers before the change. Explain what changed and what it does for them. Let them switch back for a while, so they control the timing. Give them help with the new version, open a channel for feedback, and tell them what you did with it. Measure how people feel separately from what they do. Usage often holds steady through a confusing launch while trust quietly drops, and trust takes longer to come back.
The customers from last week’s post deserve special attention here. The ones who were pretty sure they understood your product are the ones a redesign hits hardest, because the simple theory they built in their first few weeks has just stopped working. A redesign turns every customer into a new customer, so ask them the five how-questions from Pretty Sure again, a month after launch. Listen for where their explanation of the new version breaks. That is where your help text, your tooltips and your next email should go.
And for the team, one more ten-minute exercise. Before the launch review, ask everyone to write down how deep the dip will be and how many weeks it will last. Seal the answers. Open them a month after go-live. Go first, again.
The valley turns up in your dashboard a few days after launch, whether the plan expected it or not. Put it in the plan, and it arrives on schedule.
Further reading
- Erik Brynjolfsson, Daniel Rock and Chad Syverson, “The Productivity J-Curve: How Intangibles Complement General Purpose Technologies,” American Economic Journal: Macroeconomics, vol. 13, 2021.
- Aaron Sedley, “Change Aversion: Why Users Hate What You Launched (and What to Do About It),” GV Library.
- John T. Gourville, “Eager Sellers and Stony Buyers: Understanding the Psychology of New-Product Adoption,” Harvard Business Review, vol. 84, June 2006.
- Roger Buehler, Dale Griffin and Michael Ross, “Exploring the ‘Planning Fallacy’,” Journal of Personality and Social Psychology, vol. 67, 1994. Summary by Roger Buehler: Society for Personality and Social Psychology.
Leave a Reply